
Quick links:
| Overview | Load bands |
| View Cumulative Load | Using cumulative load |
| How cumulative load is calculated | Related articles |
Overview
Cumulative load is available within the PitcheroGPS Player App to help you understand how your recent workload compares with your usual workload.
Cumulative load looks at your load over the last 7 days and compares this with your average weekly load over the previous 28 days.
This helps you understand whether your current workload is lower, similar to, or higher than your usual workload.
If you have no recorded session in the last 7 days and no recorded session in the 7 days before that, there may not be enough data to calculate your full cumulative load. As a result, some cumulative load information may not be displayed.
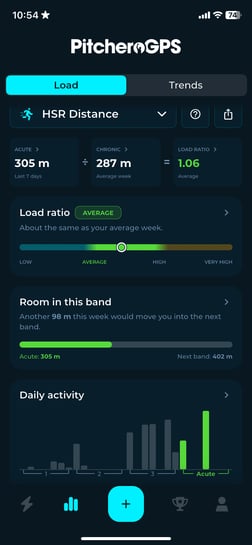
Cumulative Load - High Speed Running
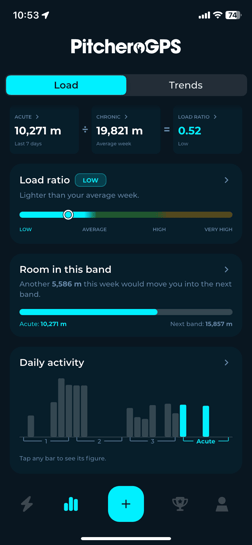
Cumulative Load - Distance
How to view Cumulative Load
Open the PitcheroGPS Mobile App, click the Trends icon from the toolbar at bottom of the screen, and select the load tab.
How Cumulative Load is calculated
Cumulative load uses three key figures:
| Metric | Description |
| Acute load | Your total recorded load for the selected metric over the last 7 days. |
| Chronic load | Your usual weekly load, calculated from your total load over the last 28 days, divided by 4. |
| Load ratio | Your acute load divided by your chronic load. This shows how your recent load compares with your usual weekly load |
A load ratio of 1.00 means your acute and chronic loads are equal.
For example, a load ratio of 1.33 means your acute load is approximately one third higher than your usual weekly load.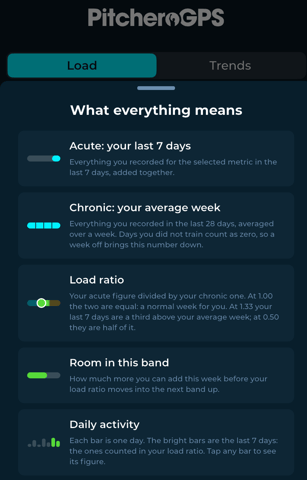
Load bands
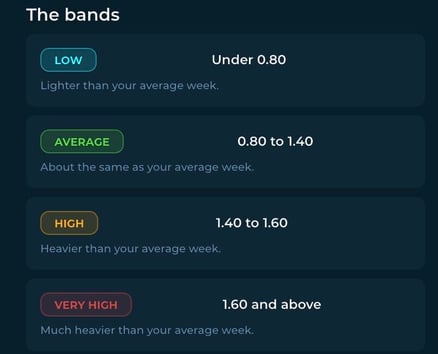
Your load ratio is placed into one of four load bands:
| Load band | Load ratio | Description |
| Low | Under 0.80 | A lighter week than usual |
| Average | 0.80 to 1.40 | About the same as usual |
| High | 1.40 to 1.60 | A heavier week than usual |
| Very high | 1.60 and above |
Much heavier than usual |
Your cumulative load
The cumulative load view shows where your recent workload sits against your usual workload.
Load ratio
Your load ratio shows how your recent load compares with your own average.
The colour of the load ratio indicates which load band you are currently in.
Room in this band
This shows how much additional load you can record before moving into the next load band.
This is intended to help you understand where your current load sits within the band and should not be interpreted as a recommendation for how much additional training you should complete.
Daily activity
Each bar represents your load for that day for the selected metric.
This allows you to see how your load has been distributed across the last 7 days.
Understanding your cumulative load
Cumulative load can help you understand your recent workload in relation to what is usual for you.
When reviewing your cumulative load, consider:
- Your current load ratio and load band.
- How your daily activity has been distributed across the week.
- How your recent workload compares with your own usual workload.
- Which performance metric is currently selected.
Your cumulative load is one way of understanding your workload and should be considered alongside the guidance provided by your coach or performance staff.
Related articles
Thanks for taking a look at this article, we hope you found it useful.
You may also find these related articles of interest too: